KiwyCharts
A fully modular widget-based NFT Analytics tool.
2022-09-18
In late 2022, the NFT/Crypto space was getting a bit quieter and less frenetic, but I still wanted to be a part of it. So, since there was less need to keep my eyes on charts, I started to think what I could build around this new-found interest.
All the analytical tools and instruments to work with this kind of data were there, but since everything was moving so quickly, mostly of these tool where pretty rough making them useful but limited and not very pleasant to use. So I decided to try and make a NFT Analytical tool that was fully modular and customizable.
The biggest challenges of this project were clear from the beginning. I had to:
-
make a "widget" system in order to have each widget display only the information that the user wanted to see, and wherever he wanted to see it.
-
use the widget system deeply to have also different user customizable layouts
-
have a complex backend infrastructure in order to continuously fetch the data from the blockchain and from the marketplaces in order to be able to display it quickly.
I tried to work on these two major problems side by side, so when I got tired of the backend work I switched on the frontend and vice versa. I wanted to make this tool available to the small community I'm in, so I wanted to think about the infrastructure from the beginning in order to have something already reachable by anyone. Since I was already quite familiar with GCP, and I had already plenty of new challenges to approach, I wanted to keep it simple and use stuff I already knew for this part.
Infrastructure
The main, very high level, design of it is something like this:
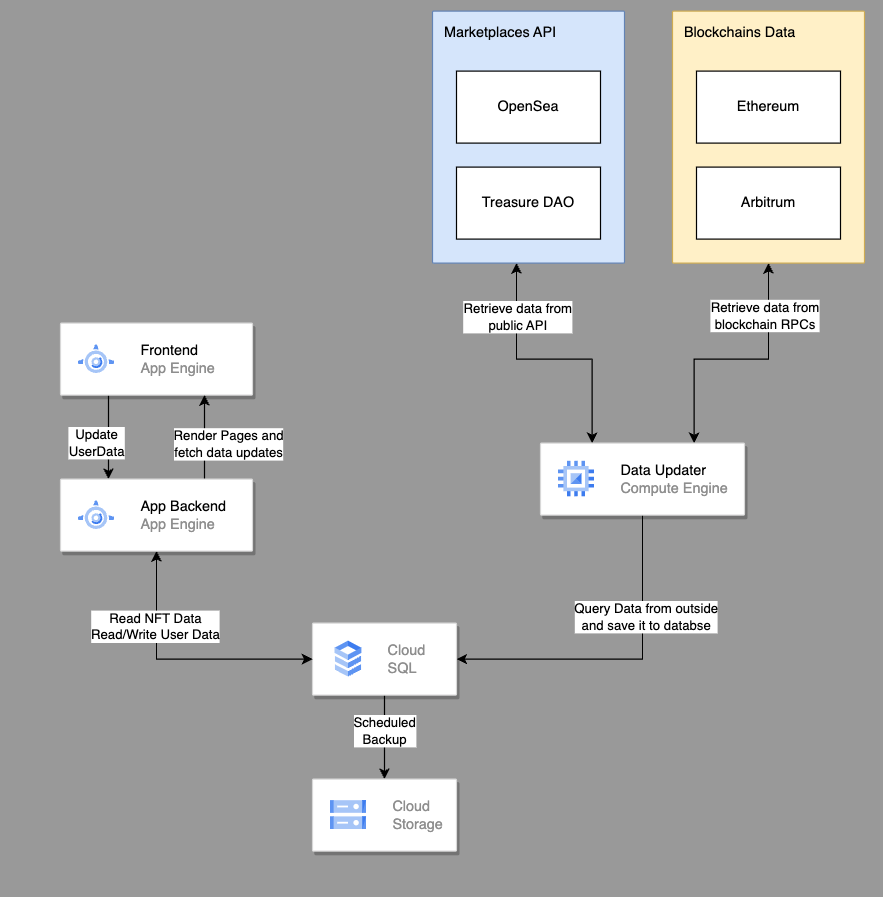
The Compute Engine unit is needed as a single always on machine that keep all the data updated by continuously fetch information from both the public marketplaces APIs (like OpenSea and TreasureDAO) and blockchain data directly via RPCs. This part is made primarily by Python scripts and crontab to keep everything running and in sync. Occasionally, this machine will also get pinged from the other Backend in order to begin special jobs for some other tasks that do not need critically updated data.
The Database is a standard MySQL database. Probably a NoSQL database would have been better for this amount of data, but again, I wanted to keep the infrastructure simple and use stuff I was familiar with it.
For the main Frontend and Backend I used App Engine, so it can spin up instances when needed and stay in idle otherwise.
The Prototype
So, about the backend there nothing too amazing about it, just lots of API calls and web3 stuff. About the Frontend, I wanted to try something new. I tried Angular, React, and other frameworks in the past, but the more I try those things, the more I feel that the right way to do a cool thing is to build it from scratch with pure JS+HTML+CSS. I'm not a fan of all the boilerplate and (sometimes) useless abstraction layers that bigger frameworks force you to use. So, I started to make my own Widget system in pure JS and it was already working great. I also wanted to make my own Charting module, but after some first attempts it was surely an interesting task, but it would have slowed me down too much, so I opted for a more production ready solution, but still very customizable and programmable. I choose D3.js which is amazing to build your own custom charts about pretty much anything you want.
The Prototype
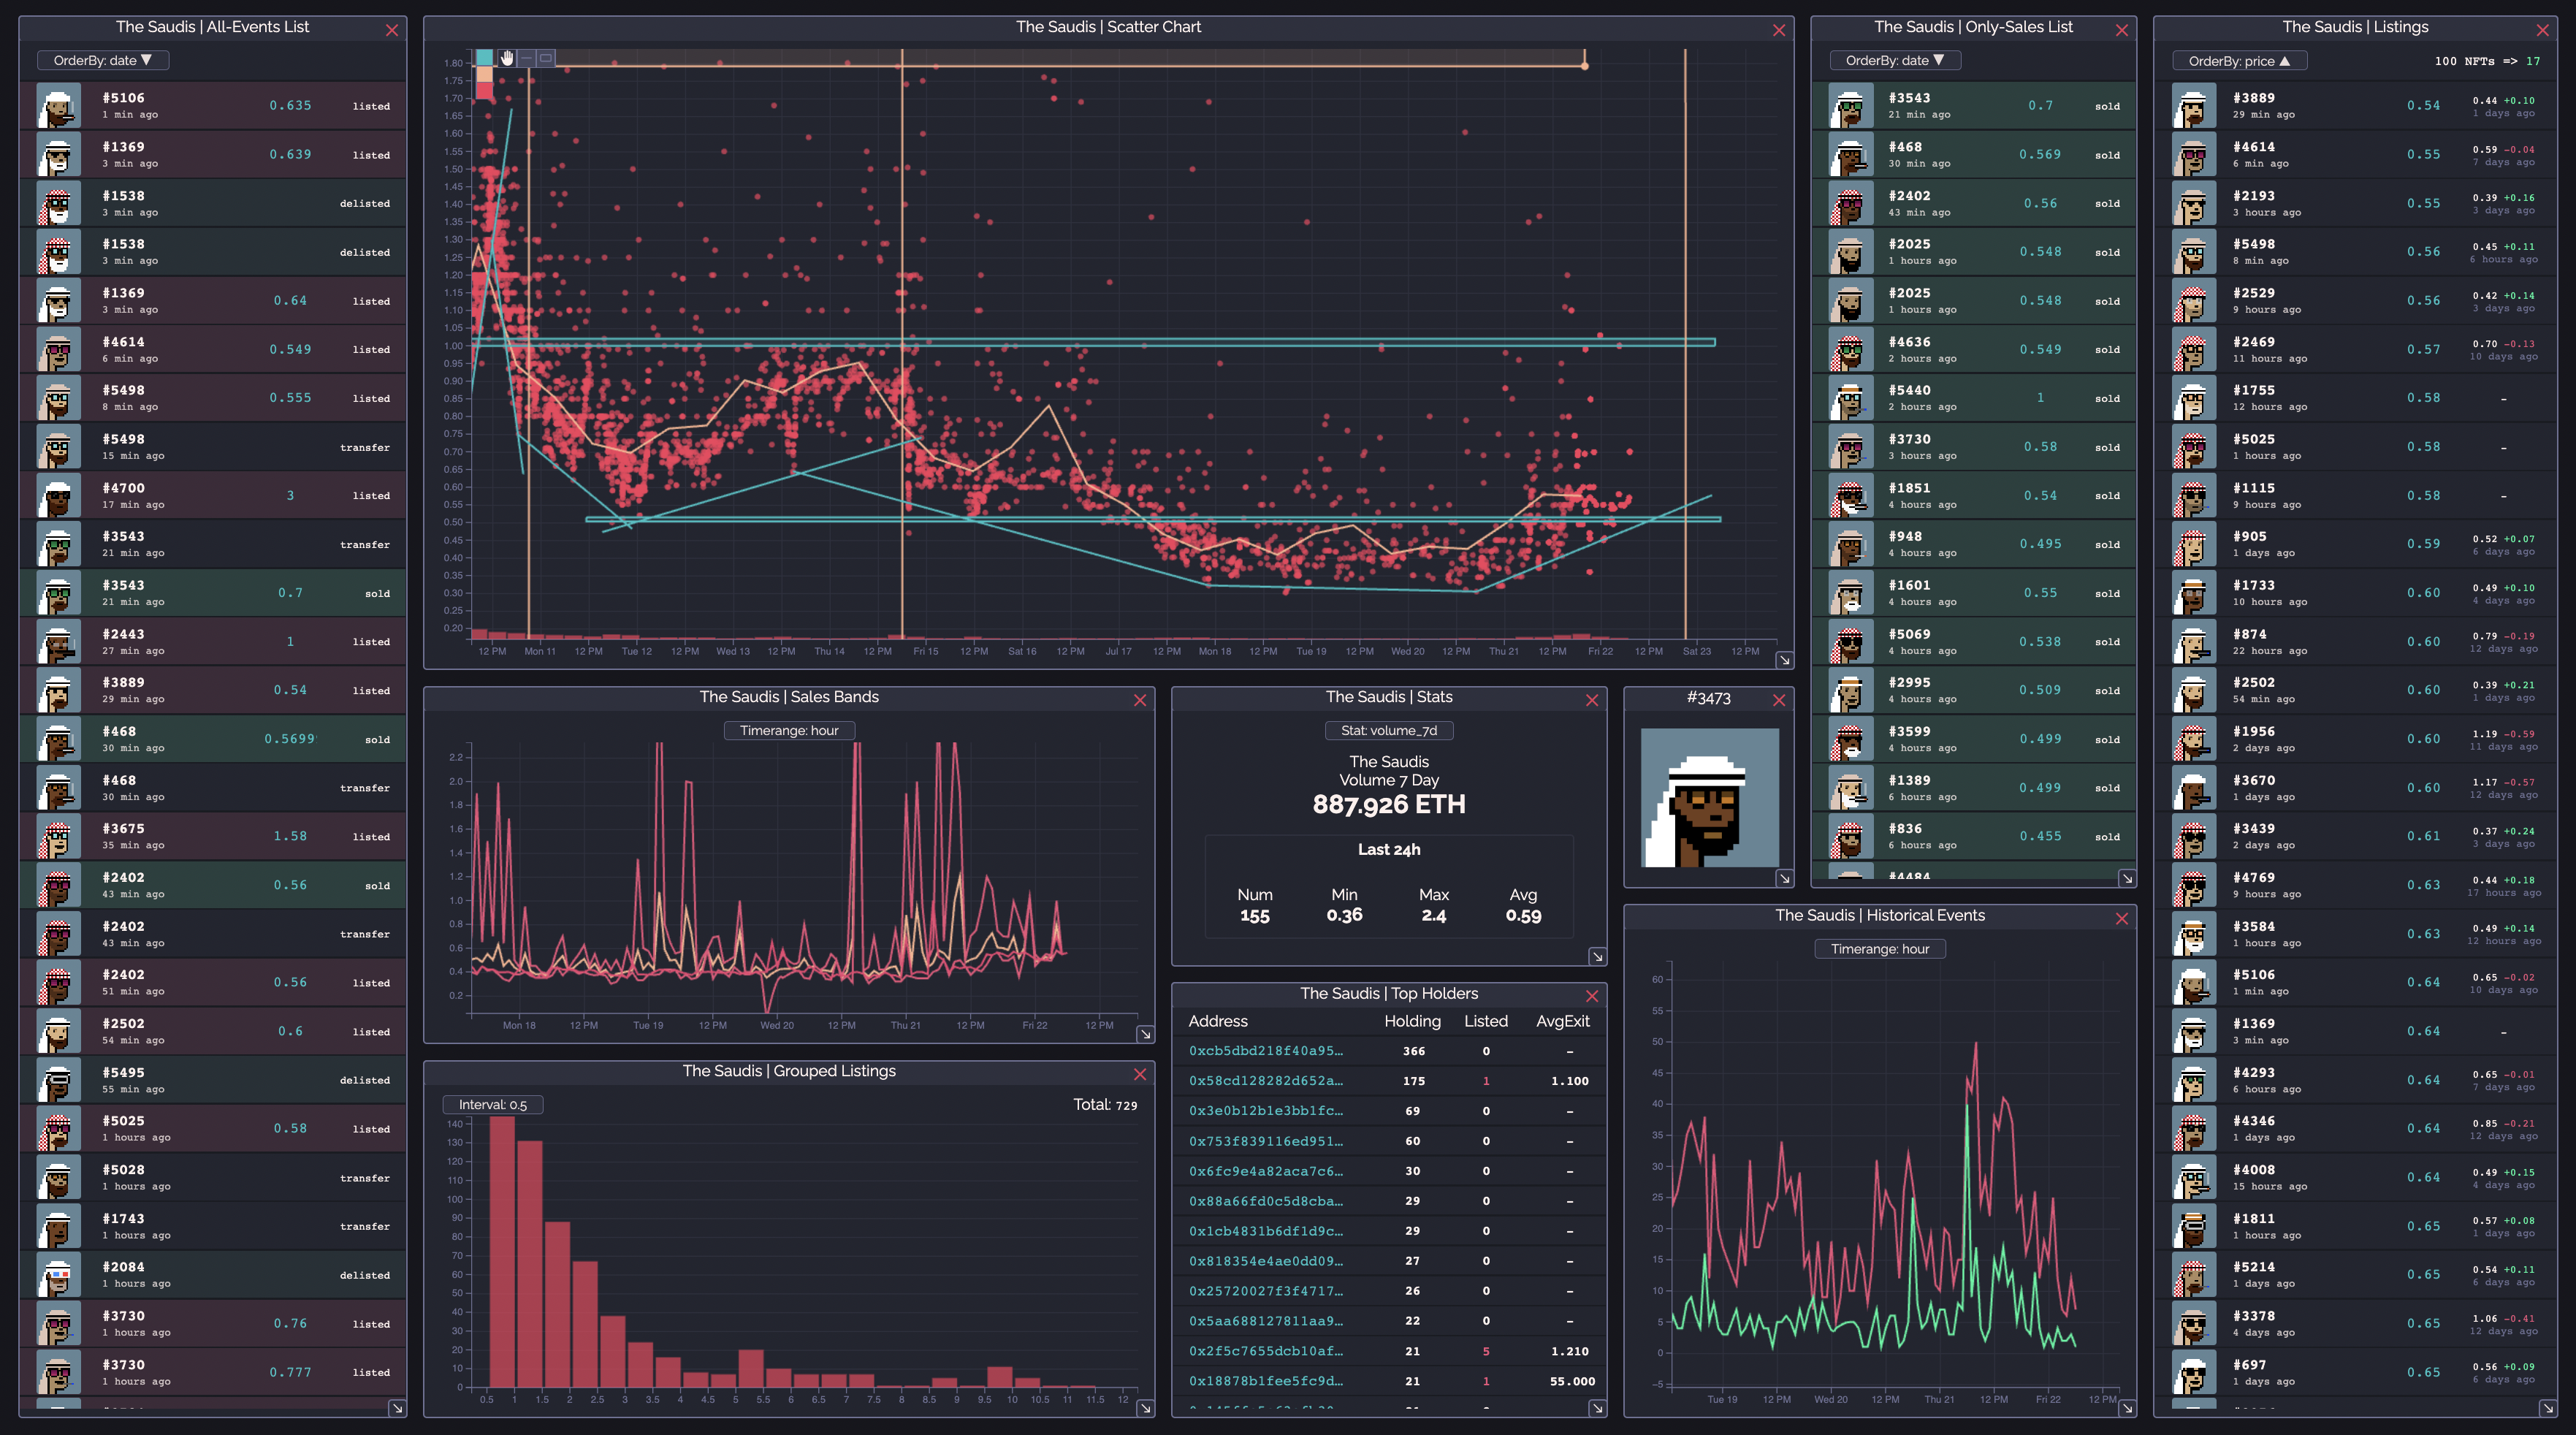
After many iterations this was the final stage of the chart widget. I managed to make a chart fully resizable on both axis independently, and also be able to draw lines and rectangles of different colors on it.
Widgets Layouts
One very cool thing that you can do with a widget system is to create different layouts displaying different information, and then be able to switch quickly between different setups.
Color themes
The final touch on it was to add a theme switch to be able to do dark/light mode and other comfy colors.
Full layout Showcase